




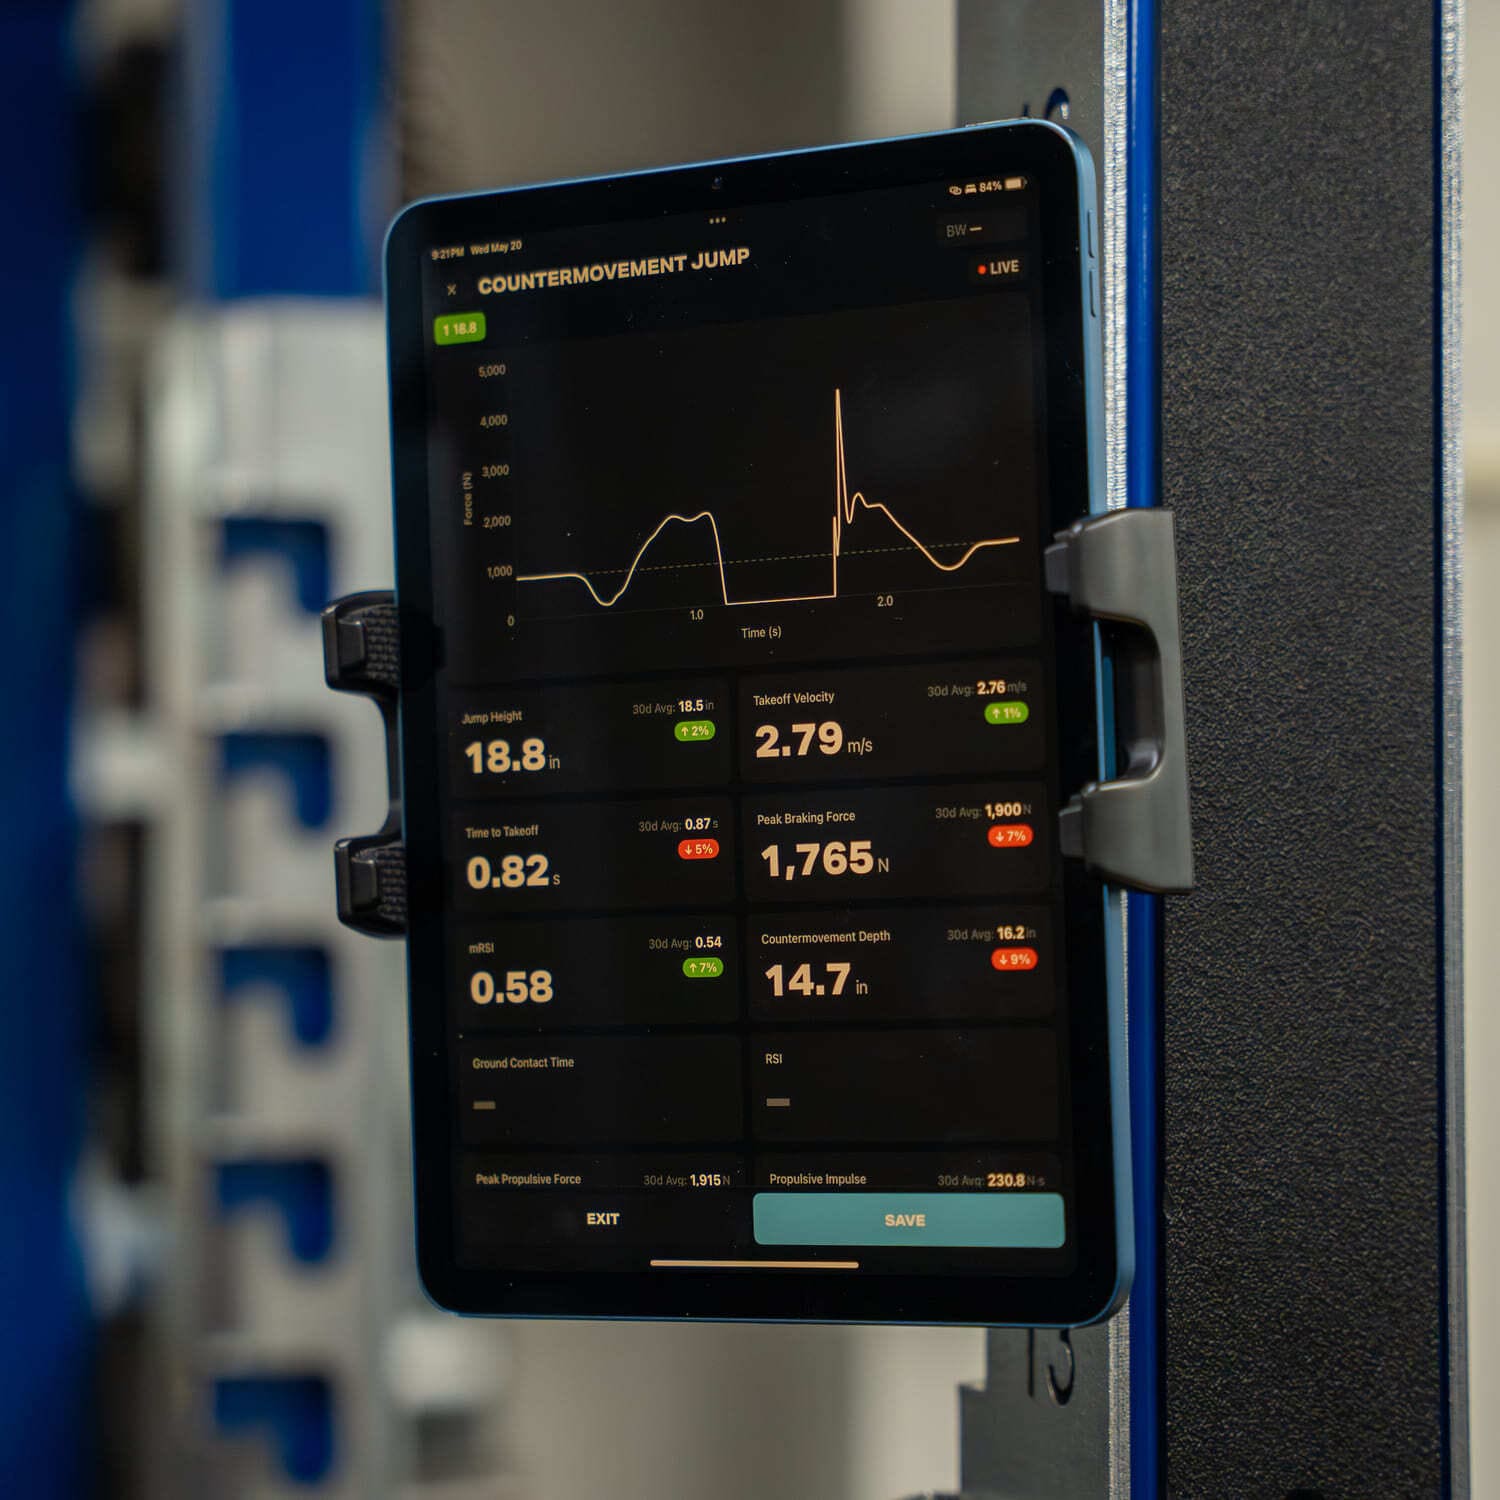
A force-time curve is the line a force plate draws as an athlete jumps: vertical force plotted against time. And how that force is applied, not just how much, is what the shape shows you. Two athletes can post the same jump height and need completely different work, because one builds a sharp spike of force in a short window while the other spreads the same push across more time. The height tells you what happened. The shape tells you why.
Most explainers either name the phases or define the metrics, then stop there. The more useful skill is reading a raw trace by eye and turning it into one training decision.
What a force-time curve actually is
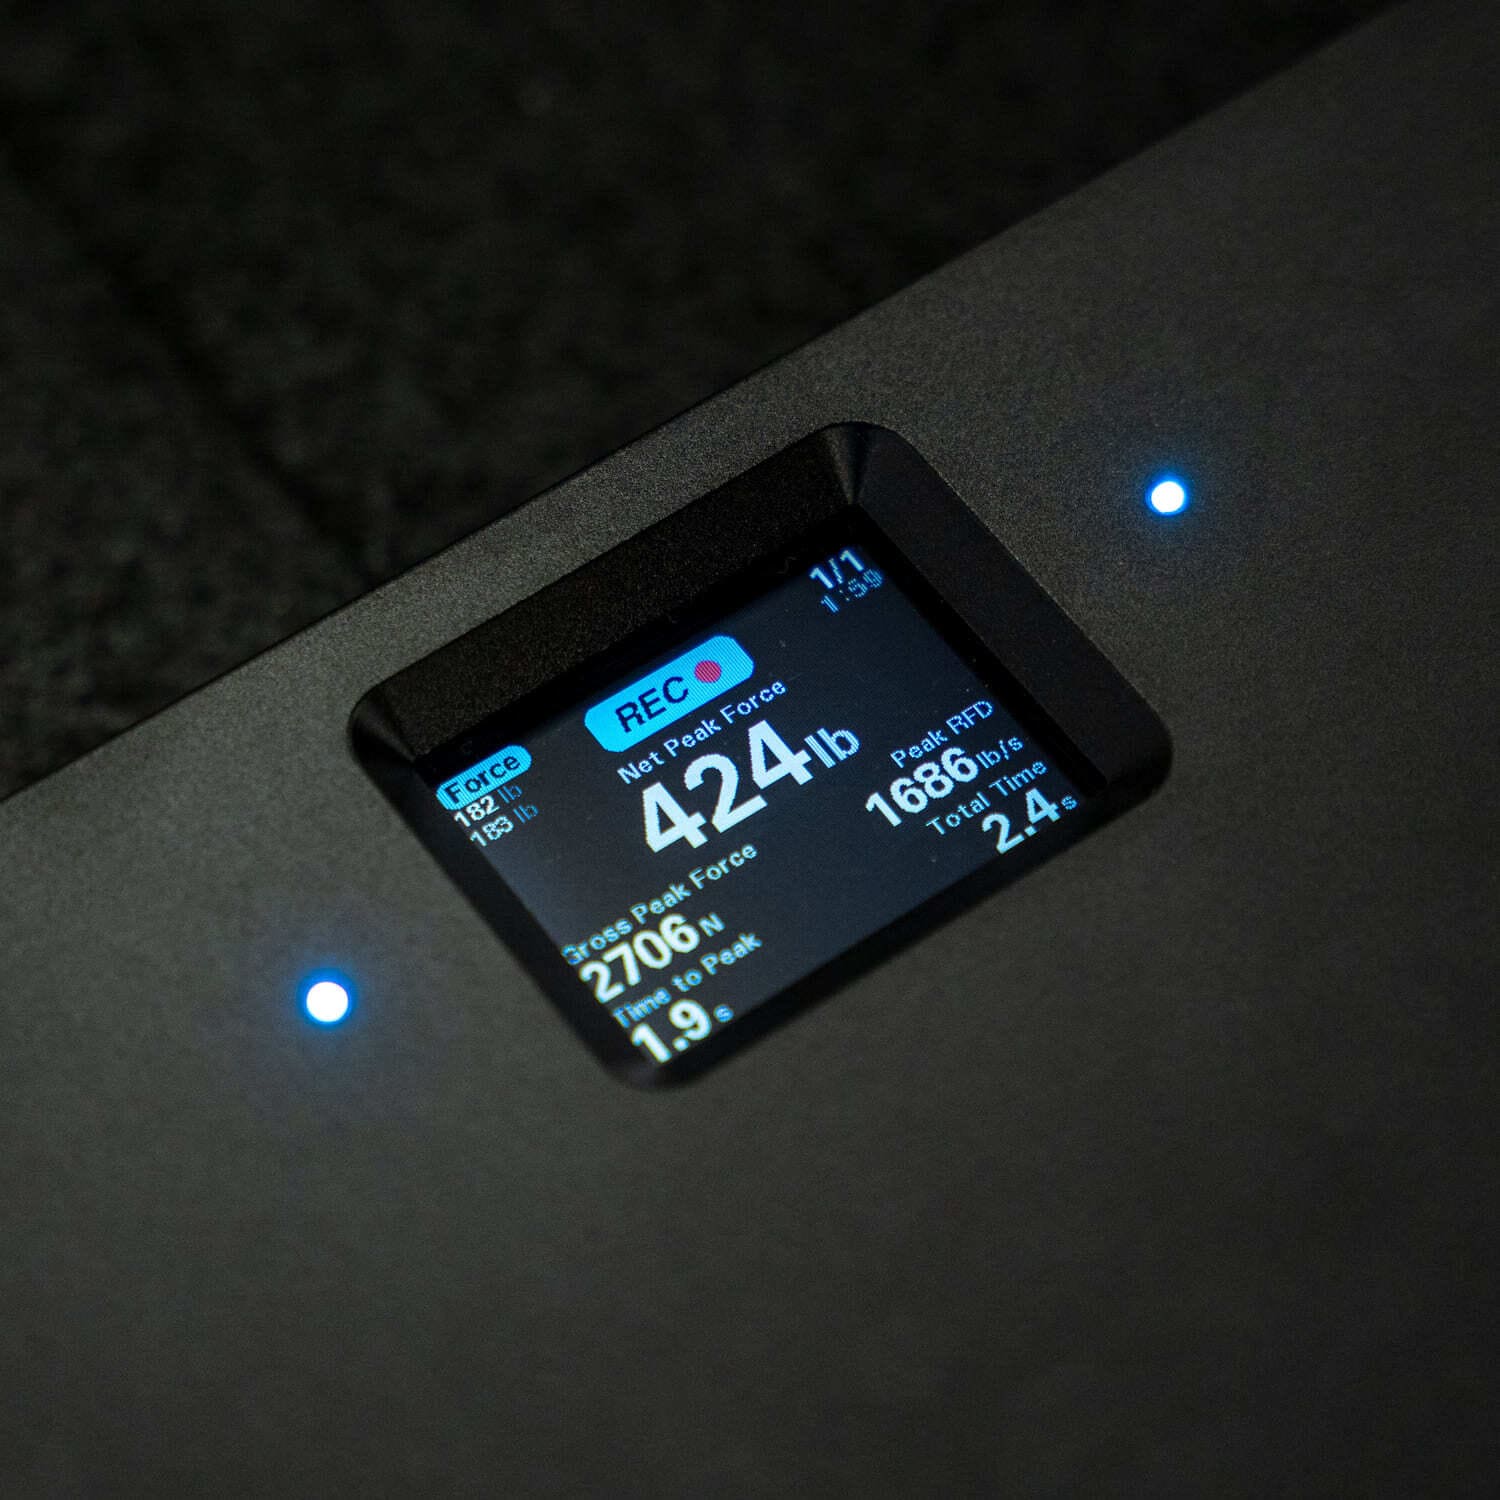
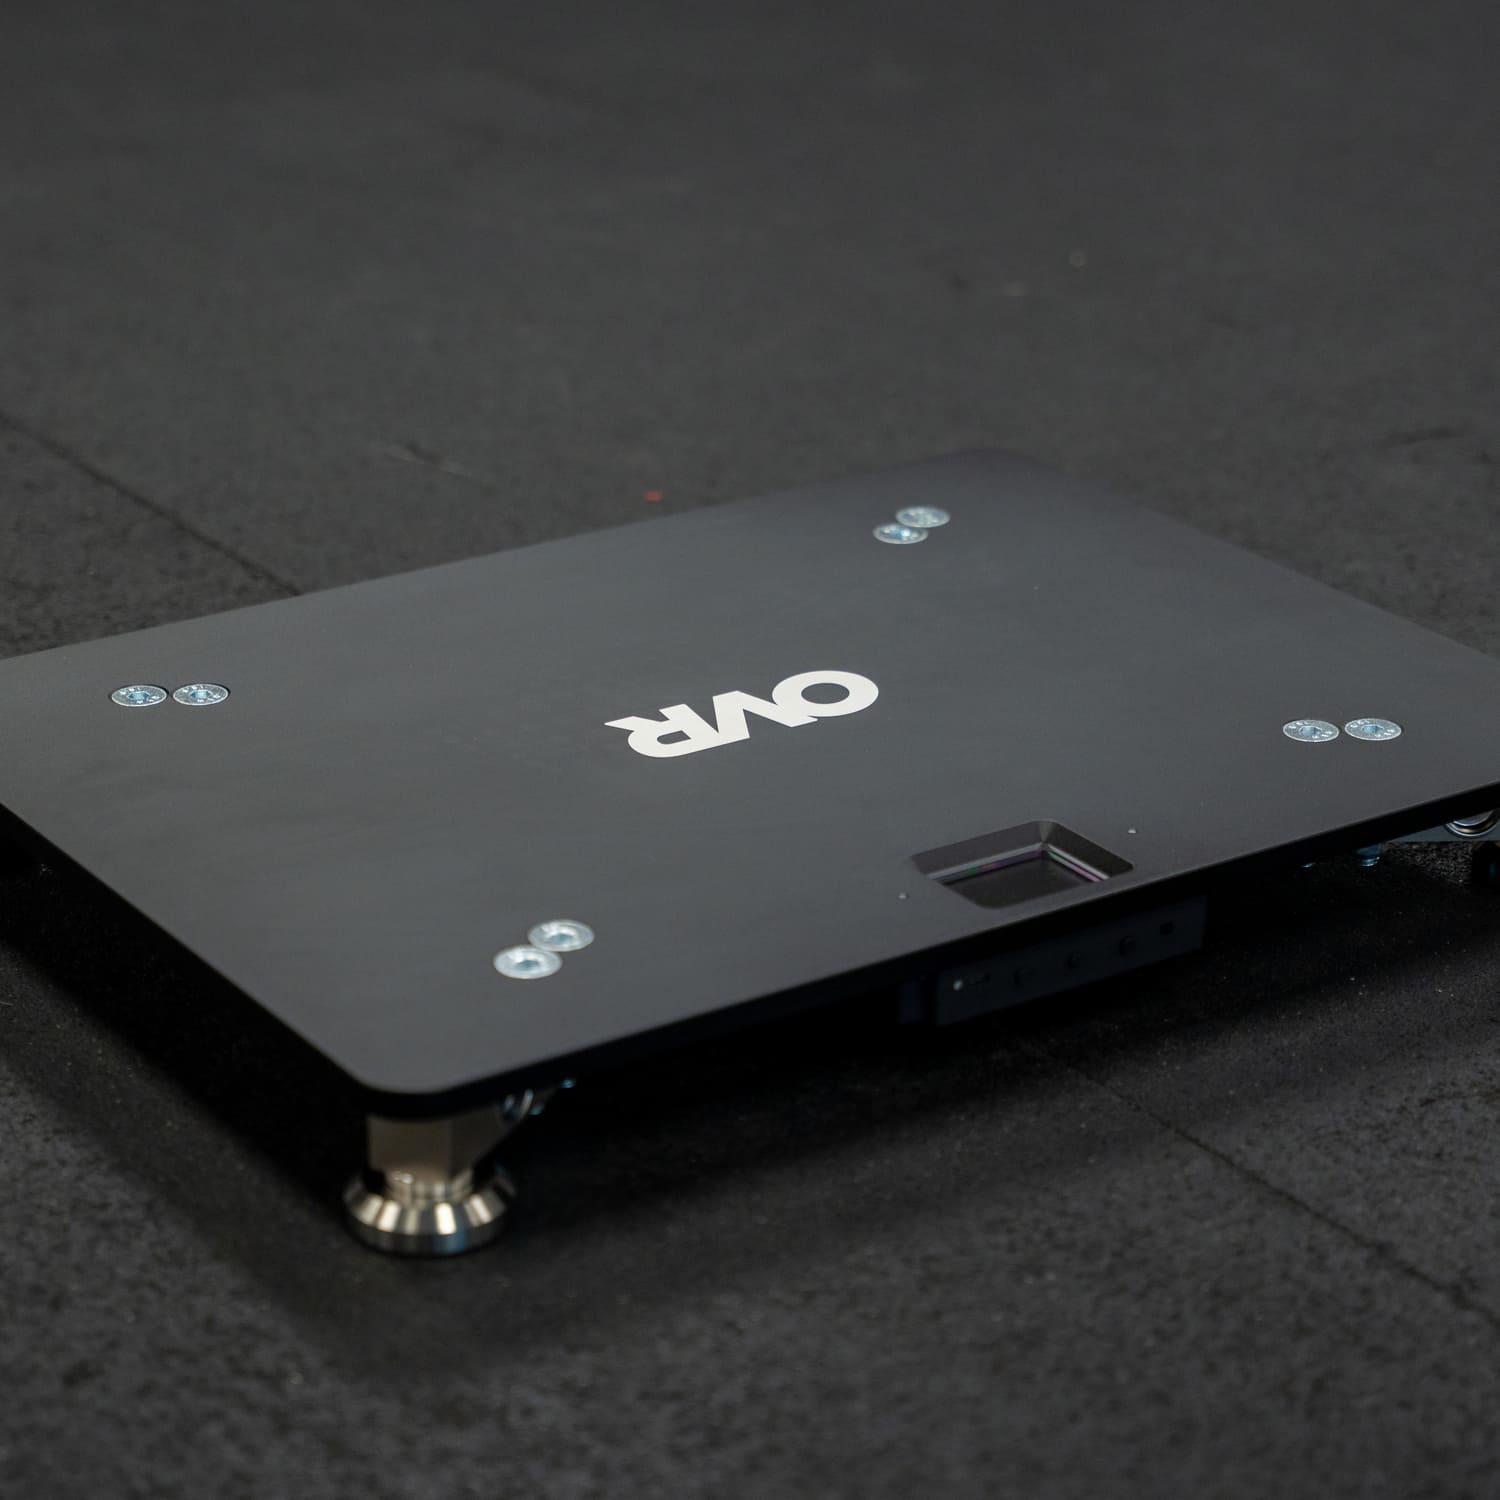
A force plate measures force into the ground, in Newtons, sampled around a thousand times a second during a countermovement jump test, so you get the whole movement drawn out. Researchers split the trace into phases (weighing, unweighting, braking, propulsion, flight, landing), but you do not read a curve by reciting them. You read it by finding a few landmarks and seeing how they sit relative to one another.
How to read one cold
Four landmarks carry almost all the work, and you read them off the raw trace, not the dashboard tiles.
Start with the flat line at the front: the athlete standing still, where force equals bodyweight. Everything is judged against it. Then the dip below it, where they drop into the countermovement and force falls under bodyweight. How far and how steeply it dips is the unweighting.
The key landmark is the bottom turnaround, the lowest point, where the athlete stops going down and starts going up. Force has climbed back above bodyweight and is high here. What matters is where that peak lands. A peak right at the bottom, while the athlete is low and loaded, is a different athlete than one whose peak shows up late on the way up, and where the peak sits tells you more than how many humps the curve has. Last, takeoff, where force drops to zero as the feet leave the plate. First movement to takeoff is the time to takeoff.
Bodyweight line, dip, turnaround, takeoff. Find those four and you can read most of what the curve says.
Why the area beats the peak
Jump height is set by net impulse: the area under the curve above bodyweight, force multiplied by how long it is applied. That area sets takeoff velocity, which sets height. Peak force alone does not decide the jump.
Two athletes with the same height can still look nothing alike on the trace. The same area can be tall and narrow (high force, short time) or short and wide (moderate force, longer time). The height number collapses both into one figure; the curve keeps them apart.
Countermovement depth is a strategy choice, not a quality grade. In one study a deep dip added about 38% more time with no loss of height, while cutting depth by a quarter cost about 8%. You read impulse to understand the height, but how it was built (rate of force climb, braking, propulsion) is what you train. Peak force and rate of force development matter too, but the area is what decides the height.
What the shape tells you to do
Reading the shape is only useful if it ends in a decision.
Peak late on the way up, never concentrating at the turnaround, long time to takeoff despite decent force: strong but slow to express it. In one study of 394 collegiate athletes, that slow-to-express group jumped around 0.29 m at about 0.96 seconds to takeoff, while the most explosive hit roughly 0.37 m at about 0.73 seconds. Bias explosive intent: ballistic work, velocity-focused lifting, jumps cued to move fast. A slow force build is a rate of force development problem, which is its own topic.
A second, late hump after a weak start, with a shallow slope into the dip: poor absorption into the bottom. Bias the braking side: eccentric work, tempo and pause squats, landing mechanics. How force splits between braking and propulsion is its own topic.
A strong, fast single hump but low height for size, or a thin propulsive area after the bottom: the push is the limiter. Bias strength and ballistic output.
A bigger question sits above all three reads. Is the athlete strong but slow to turn that strength into speed, or already converting most of what they have? The first wants ballistic and plyometric work to express the strength they already own. The second wants heavier strength work to raise the ceiling. That tradeoff between power and strength sets the overall direction, and the shape tells you where to fine-tune it.
Don't over-read one trace
The trace is only as clean as the jump. An arm swing, a pause at the bottom, a knee tuck, or a wandering dip all distort the shape, and a noisy early read is usually technique, not a real deficit. Check execution first.
Compare like for like or not at all: lock the protocol or the comparison means nothing. Fatigue shows in the shape before it shows in height, as a tired athlete holds the same height with a flatter, longer profile. On a dual plate, a left-versus-right gap often shows in braking first. The value is in tracking how a curve changes across a block, not any one jump.
The isometric mid-thigh pull is the same idea with no jump: pull hard against a fixed bar, read for peak force and how fast force climbs. It is a second window onto the same athlete, and peak force off it is one of the most stable numbers a plate gives you.
Learning to read the curve
The shape tells you why a jump happened and which way to train next, and it does not require a lab. A coach who reads height alone has one number. A coach who reads the curve has the whole movement, and over a season that is the difference between guessing why an athlete is stuck and knowing where the force is going.
Sources
- McMahon JJ, Suchomel TJ, Lake JP, Comfort P (2018). Understanding the Key Phases of the CMJ Force-Time Curve. Strength & Conditioning Journal: https://journals.lww.com/nsca-scj/fulltext/2018/08000/understanding_the_key_phases_of_the.10.aspx
- Ferreira ARP, Macedo VOC, Boullosa D, Vieira A (2023). Identifying Consistent Metrics from the Force-Time Curve of the CMJ. International Journal of Exercise Science: https://pmc.ncbi.nlm.nih.gov/articles/PMC10464753/
- Kirby TJ, McBride JM, Haines TL, Dayne AM (2011). Relative Net Vertical Impulse Determines Jumping Performance. Journal of Applied Biomechanics: https://journals.humankinetics.com/view/journals/jab/27/3/article-p207.xml
- Guess TM, et al. (2020). Force-Time Waveform Shape Reveals CMJ Strategies of Collegiate Athletes. Sports: https://pmc.ncbi.nlm.nih.gov/articles/PMC7761544/
- McHugh MP, Cohen JA, Orishimo KF, Kremenic IJ (2024). Effect of Countermovement Depth on the Neuromechanics of a Vertical Jump. Translational Sports Medicine: https://pmc.ncbi.nlm.nih.gov/articles/PMC11208864/
- Merrigan JJ, Stone JD, Hornsby WG, Hagen JA (2020). Identifying Reliable and Relatable Force-Time Metrics in Athletes (IMTP and CMJ). Sports (Basel): https://pmc.ncbi.nlm.nih.gov/articles/PMC7824153/
- Comfort P, et al. (2019). Standardization and Methodological Considerations for the IMTP. Strength & Conditioning Journal: https://e-space.mmu.ac.uk/626030/1/Comfortetal.-StandardizationandmethodologicalconsiderationsfortheIsometricMid-ThighPull.pdf
- VALD Performance. Sampling Frequency: How Much Is Enough?: https://valdperformance.com/news/sampling-frequency-how-much-is-enough
- SimpliFaster. Everything You Need to Know About the CMJ on Force Plates: https://simplifaster.com/articles/countermovement-jump-force-plates-guide/
- SimpliFaster. Force Plates in Practice: What I Learned in My First Year: https://simplifaster.com/articles/force-plates-in-practice-what-i-learned-in-my-first-year/
- Sportsmith. Top Three Force Plate Metrics, a View of 6 Experts: https://www.sportsmith.co/articles/top-three-force-plate-metrics-and-what-are-they-telling-us-a-view-of-6-experts/
- Cuk I, et al. Larger Countermovement Increases Jump Height: https://www.ncbi.nlm.nih.gov/pmc/articles/PMC6316300/
- Global Performance Insights. Analysing the CMJ Force-Time Curve Part 1: https://www.globalperformanceinsights.com/post/analysing-the-countermovement-jump-cmj-force-time-curve-part-1

Leave a comment
This site is protected by hCaptcha and the hCaptcha Privacy Policy and Terms of Service apply.